How to Beat Inflation: Monitoring Real Return with HICP Benchmarks in DonkyCapital
In our portfolio tracking mistakes guide, we saw how inflation can turn a positive nominal return into a real loss. But knowing the problem isn't enough: you need a tool that shows you, year by year, whether your portfolio is truly beating inflation.
DonkyCapital integrates Eurostat HICP (Harmonised Index of Consumer Prices) data directly into the Performance Timeline widget, letting you overlay European inflation on your return chart. The result: an immediate view of real return, without manual calculations.
Why Compare Against Inflation, Not Just Markets
Most investors use stock indices as benchmarks — S&P 500, EURO STOXX 50, DAX. That makes sense: you want to know if you're beating the market. But there's a more fundamental question that's often ignored: is your portfolio creating real wealth, or are you just preserving nominal capital while its real value erodes?
A portfolio that gains +7% in a year with 9% inflation has lost purchasing power. Investing to preserve purchasing power is the minimum goal of any long-term strategy — and it's the first thing to monitor before even comparing yourself with the markets.
The return that truly matters
- → 2022: portfolio +7%, HICP EU inflation +9.2% → real return −2.0%
- → 2021: portfolio +12%, HICP EU inflation +2.6% → real return +9.2%
- → 2023: portfolio +8%, HICP EU inflation +5.4% → real return +2.5%
- → Formula: real return = [(1 + nominal) / (1 + inflation)] − 1
To learn more about the impact of inflation on returns and other common mistakes, read our guide to 5 portfolio tracking mistakes.
How to Configure the Benchmark in the Performance Timeline Widget
The benchmark is configured directly in the Performance Timeline widget. It takes three clicks:
- 1Open the Performance Timeline widget in your DonkyCapital dashboard
- 2Click the gear icon ⚙ in the top right of the widget to open settings
- 3In the "Benchmark" section, select "HICP European Union" from the dropdown (or your country's HICP variant)
- 4Click "Save Changes" — the chart will update immediately
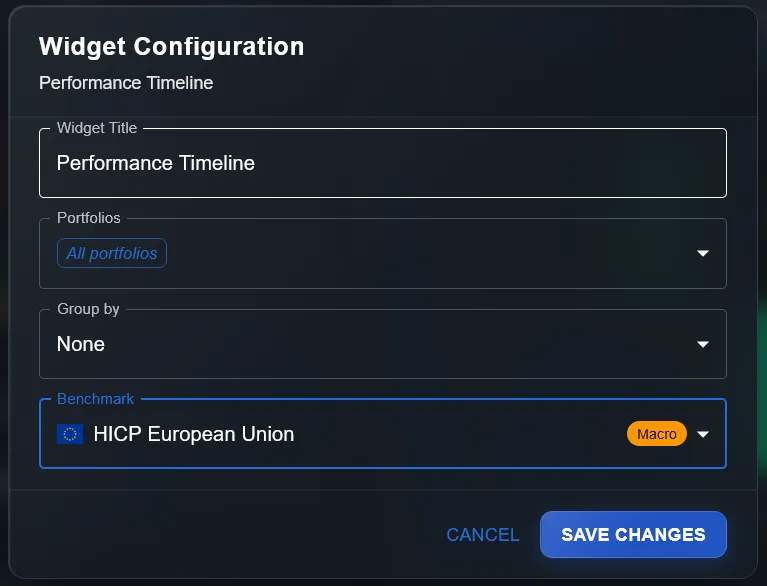
The Benchmark section in the Widget Configuration panel. The "Macro" tag distinguishes inflation benchmarks from stock market indices.
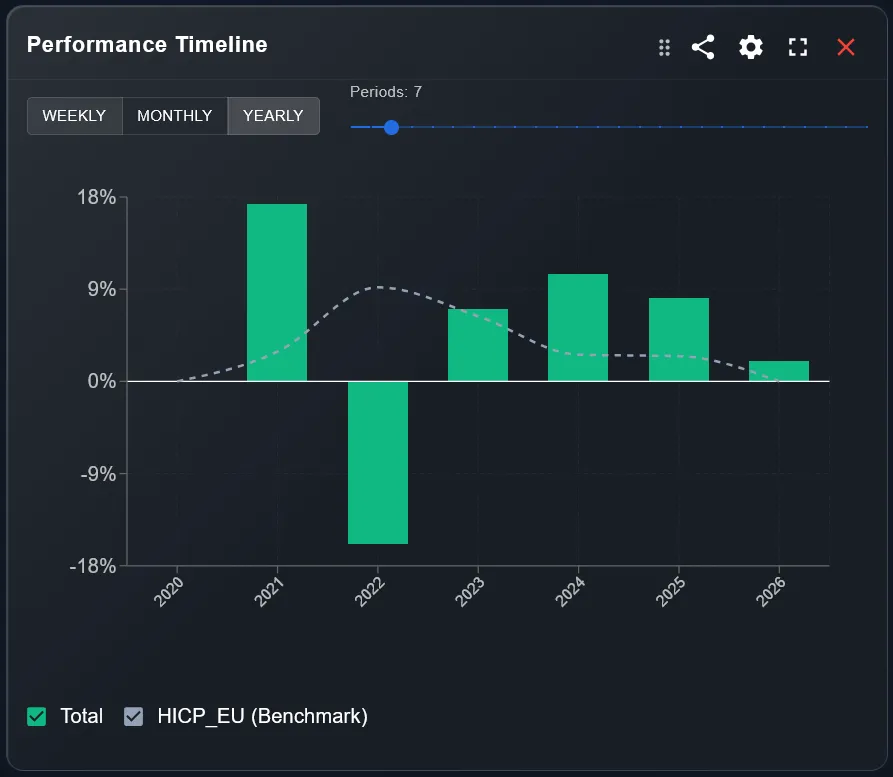
How to Read the Return vs Inflation Chart
Once configured, the widget overlays the dashed inflation line on the return bars. Before reading the chart, choose the time granularity that best fits your goal:
Three available views
Green bar above the dashed line
Positive real return — the portfolio beat inflation that year
Green bar below the dashed line
Negative real return — inflation eroded the nominal gain
Bar below zero
Both nominal and real loss — the double negative effect of 2022
Analysis of the real example shown
- →2021: return ~+17% vs HICP ~+2.6% → excellent real return (+14%)
- →2022: return ~−16% vs HICP ~+9.2% → devastating year in real terms (real loss ~−23%)
- →2023: return ~+7% vs HICP ~+5.4% → thin real return, barely positive
- →2024: return ~+10% vs HICP ~+2.7% → solid real return (+7%)
- →2025: return ~+8% vs HICP ~+2% → good real return
⚠ 2022 already looks bad at −16% nominal, but overlaying HICP reveals that the loss of purchasing power was approximately −23% real. Without this comparison, the damage is systematically underestimated.
All Available Benchmarks in DonkyCapital
DonkyCapital offers two categories of benchmarks, selectable from the widget configuration panel menu:
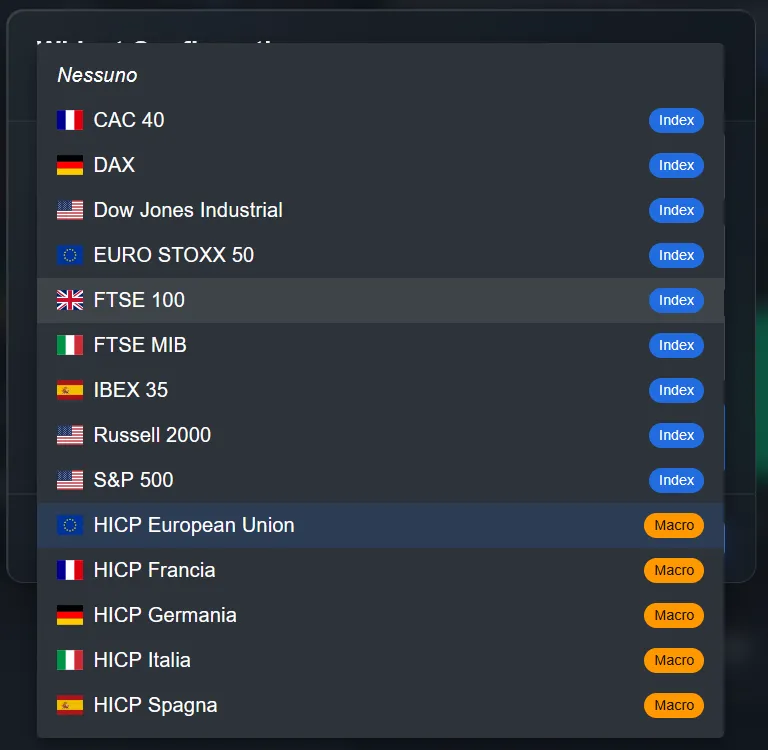
The menu shows "Index" benchmarks (stock market indices) and "Macro" benchmarks (HICP inflation indicators by country).
IndexIndex Benchmarks — market comparison
- ·S&P 500 — the primary American stock index (500 large US companies)
- ·EURO STOXX 50 — the 50 largest companies in the Eurozone
- ·DAX — German stock index (40 blue chips)
- ·FTSE 100 — British index of top 100 capitalizations
- ·FTSE MIB — Italian stock index (40 main Italian Exchange stocks)
- ·CAC 40 — French stock index
- ·IBEX 35 — Spanish stock index
- ·Dow Jones Industrial — 30 historic large American companies
- ·Russell 2000 — American small caps (2000 small US companies)
MacroMacro Benchmarks — HICP inflation comparison
- ✓HICP European Union — average inflation across the entire Eurozone (recommended as baseline)
- ✓HICP Italy — Italian-specific inflation (ideal for those spending primarily in Italy)
- ✓HICP Germany — German inflation
- ✓HICP France — French inflation
- ✓HICP Spain — Spanish inflation
Use the HICP of your country of residence if your daily expenses are primarily in that currency and price context. HICP EU is more suitable for those with an international spending profile or who want a neutral European benchmark.
Which Benchmark to Choose Based on Your Profile
Global ETF investor (MSCI World, All World)
→ HICP EU as inflation baseline
Add S&P 500 on a second widget to see comparison with the US market
Predominantly European portfolio
→ HICP EU or your country's HICP
Then EURO STOXX 50 for comparison with the European market
Main goal: preserve real capital
→ HICP EU or national HICP
Inflation is the minimum benchmark to beat before any other comparison
Want to know if you're a good stock picker?
→ S&P 500 or the reference index of your main market
If you beat the reference market, you're creating real alpha
Frequently Asked Questions
Can I use the benchmark on periods other than yearly?
Yes. The Performance Timeline widget supports weekly, monthly, and yearly views. You can use the HICP benchmark in any of these modes, though the annual view is the most meaningful for long-term real return analysis.
Is HICP data updated in real time?
HICP data is published by Eurostat on a monthly basis and is updated in DonkyCapital as soon as it becomes available. The current month's data may not yet be available if it hasn't been released by Eurostat.
Can I overlay both a stock index and HICP on the same chart?
Currently the widget supports one benchmark at a time. To compare your portfolio against both inflation and a stock index, you can add two instances of the Performance Timeline widget to the dashboard, each with its own benchmark.
Why is my manually calculated real return different from what I read in the chart?
The chart overlays the two series visually — it doesn't automatically calculate the difference. The bar shows nominal return, the line shows inflation. To calculate the exact real return, use the formula: [(1 + nominal return) / (1 + HICP inflation)] − 1.
What is the difference between MSCI World and S&P 500 as benchmarks?
The S&P 500 tracks the 500 largest US companies and is the dominant benchmark for investors with primarily American equity exposure. The MSCI World includes approximately 1,500 companies from 23 developed countries, with the US representing around 65–70% of the index. For a European investor with a global portfolio, the MSCI World is generally more representative. By adding both to separate DonkyCapital widgets, you can directly compare how much of your performance is driven by the US market versus global developed markets.
Can I use inflation as my only benchmark?
Yes — and in fact it should be the minimum benchmark every investor tracks. Beating inflation is the necessary condition for preserving purchasing power over the long term. However, it is not sufficient to evaluate portfolio quality: a portfolio returning 3% with 2% inflation beats inflation, but would significantly underperform any diversified equity index. HICP comparison should be your first check, not your only one.
How often should I compare my portfolio to the benchmark?
It depends on your investment horizon. For meaningful evaluation, the annual view is most informative: it filters out short-term noise and enables a clean comparison against the annual HICP inflation figure. The monthly view is useful for identifying periods of strong divergence — such as the inflation spikes of 2022. The weekly view is too granular for drawing strategic conclusions about real return.
What does it mean if I consistently underperform my benchmark?
It depends on which benchmark. If you underperform HICP inflation for several consecutive years, you are losing purchasing power — a signal that your strategy needs review. If you underperform the S&P 500 but still beat inflation, you may be building real wealth, just less efficiently than a passive ETF. Systematic underperformance versus a market benchmark is a strong argument for reviewing your active allocation and considering broader diversified passive instruments.
Should I change my benchmark if my strategy changes?
Yes. Your benchmark should reflect your current strategy, not a past one. If you have shifted from a predominantly US equity portfolio to a global approach, replacing the S&P 500 with the MSCI World as your market benchmark makes sense. Similarly, if capital preservation has become your primary goal rather than aggressive growth, giving more weight to the HICP benchmark is the right choice. In DonkyCapital, you can change the benchmark at any time directly from the widget configuration panel.
Does DonkyCapital support custom benchmarks?
Currently DonkyCapital offers a curated selection of predefined benchmarks: major stock market indices (S&P 500, DAX, EURO STOXX 50, and others) and country-level HICP macro benchmarks. Uploading a fully custom index is not yet supported. However, you can use the Rebalance function in Capital Management to compare your portfolio against a model portfolio of your own design — which is functionally equivalent to a custom benchmark for allocation purposes.
Start Monitoring Your Real Return
Configure the HICP benchmark in your Performance Timeline widget and instantly see whether your portfolio is truly beating inflation — year by year, without calculations.
Access DonkyCapital for FreeFree Early Access · No credit card required